How TTN training shows up in GP Patient Survey results
In general practice, the busiest moments are not always in the consulting room. They are at the front door of access: the phone lines, the first conversation, the next-step explanation, and the split-second decisions that the team makes when a patient is anxious, frustrated or simply needs help quickly.
Those are human moments. And human moments can be trained and developed.
For years, patient-facing training, communication, customer service, conflict management, de-escalation, has been described as hard to evidence. The Training Network took a different route: use the National Health Service’s own published patient experience data to track whether the experience is improving.
The dataset that turns soft skills into measurable outcomes
Since 2023 the General Practice Patient Survey publishes practice-level results. It is one of the few national datasets that captures what patients actually experience when they try to contact their practice and navigate the system.
So we asked a simple question:
If training is working, do we see a shift in the General Practice Patient Survey measures that are a direct proxy for communication quality, service behaviours, clarity, and reduced friction at the point of contact?
The cohort: real practices, real training, real-world pressure
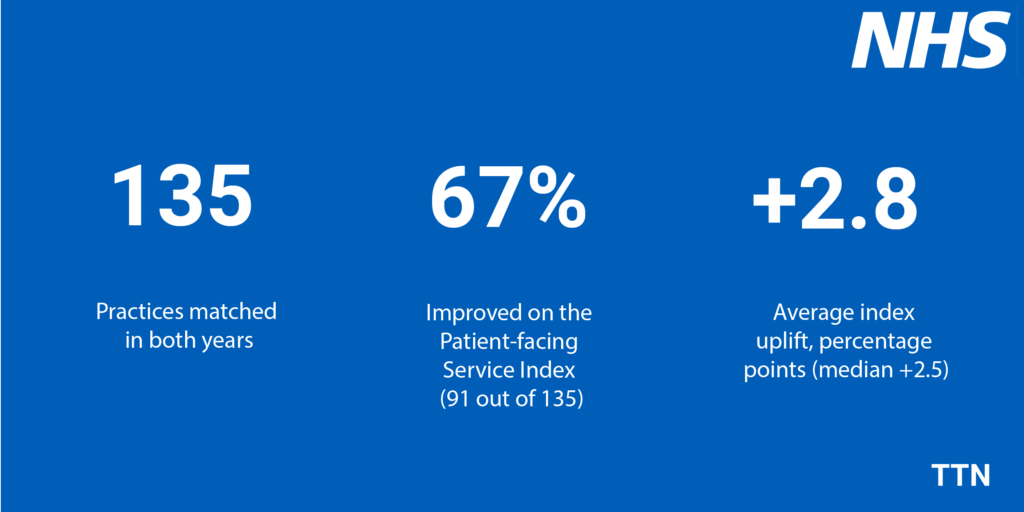
For this analysis, we used our training schedule file and randomly picked 135 practices that had received training over a three year period. These were then matched in both the General Practice Patient Survey 2024 and General Practice Patient Survey 2025 practice datasets, creating a clean, like-for-like year-on-year comparison.
What we measured: a Patient-facing Service Index
Instead of cherry-picking one metric, we tracked a basket of five General Practice Patient Survey positive measures that training is most likely to influence:
• Ease of contacting the practice by phone (patients reporting easy)
• Helpfulness of reception or administrative staff (patients reporting helpful)
• Overall experience when last contacting the practice (patients reporting good)
• Knowing the next step after contacting the practice (patients reporting yes)
• Overall experience of the practice (patients reporting good)
Together, these form a simple composite: a Patient-facing Service Index, a practical way of seeing whether the front door experience is getting better.
The results: improvement is the norm, not the exception
Across the 135 practices:
• 67% improved on the Patient-facing Service Index (91 out of 135 practices)
• The average improvement was +2.8 percentage points (median +2.5 percentage points)
And the direction of travel was consistent across the areas you would expect training to move.
Average year-on-year change (percentage points) across trained practices:
• Phone access (easy): +4.1 percentage points
• Reception helpfulness (helpful): +2.0 percentage points
• Contacting experience (good): +0.9 percentage points
• Next-step clarity (yes): +4.2 percentage points
• Overall experience (good): +2.8 percentage points
These are not abstract measures. They are the everyday experience of patients trying to reach help, and the everyday experience of staff handling those interactions under pressure.
The human story behind the numbers: what better looks like
When communication improves, frustration falls
A patient who understands the next step is less likely to call back repeatedly, escalate emotionally, or lose trust. That is why next-step clarity is such a powerful signal, and in this cohort it increased by +4.2 percentage points on average.
Training that strengthens explanation, signposting, expectation-setting, and confident language does not just create nicer conversations. It creates fewer repeat contacts, fewer misunderstandings, and fewer flashpoints.
When the front door runs better, staff pressure eases
Staff wellbeing is not directly measured by the General Practice Patient Survey. But patient experience is often a mirror of staff strain: when teams are burnt out, patience shortens, clarity drops, and conflict rises.
A year-on-year improvement across multiple patient-facing measures is consistent with a healthier operating rhythm, clearer conversations, fewer repeat contacts, and less friction during busy periods.
What this proves, and how we talk about it responsibly
This is an important point: the General Practice Patient Survey is an independent outcome signal. It does not record training attendance, so we do not claim the survey proves causation on its own.
What it does show is that, across a real-world cohort of practices that received training, the metrics most aligned to communication quality, service behaviour and friction reduction shifted positively year-on-year, at scale.
And that gives commissioners and practice leaders something valuable: a credible, published dataset that can be used to track whether patient-facing experience is moving in the right direction.
The Training Network’s evidence-based approach
The model is simple:
- Deliver training focused on the moments that matter (contact, conversations, de-escalation, clarity)
- Track outcomes using survey measures that reflect those behaviours
- Strengthen attribution with training dates, attendance and internal key performance indicators (complaints, incidents, call abandonment)
Closing: Why this matters now
Primary care needs solutions that are practical, scalable, and measurable. When the front door works better, patients feel supported and staff feel less battered by the day.
The Training Network’s approach turns training from a cost into an evidence-led improvement tool: behaviour change that shows up in the National Health Service’s own published outcomes.
Related
Discover more from The Training Network
Subscribe to get the latest posts sent to your email.